InsightX: Real-world applications of targeted survey campaigns
InsightX: Case Study
Real-world applications of targeted survey campaigns
Introduction
InsightsX helps brands, agencies, and product teams make smarter, data-driven decisions by uncovering what customers really think.
Through tailored surveys and clear analysis, we reveal audience preferences, behaviors, and expectations — empowering you to refine products, choose the right channels, and craft strategies that resonate and drive growth.
🛒 Walmart Case Study
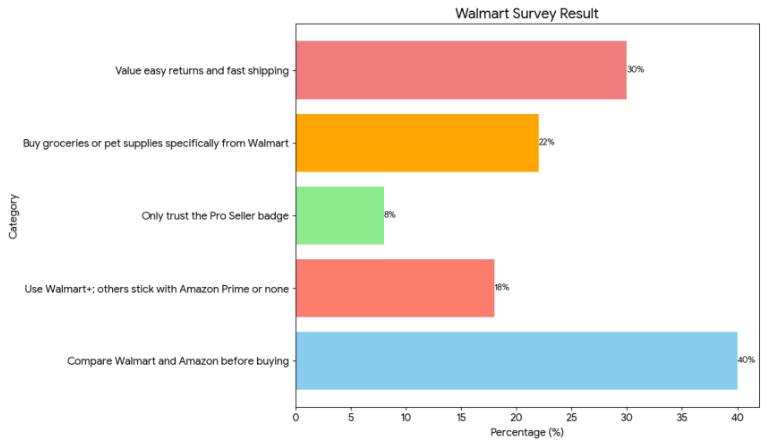
Walmart may be growing fast, but how do shoppers really feel about it compared to Amazon? Before jumping in, it’s worth understanding where the platform stands in the minds of everyday buyers.
What we asked:
- Do you compare prices or products between the two before buying?
- Do you already have Walmart+ or plan to subscribe?
- Does seeing the Pro Seller badge make you more likely to buy?
- Which kinds of products do you prefer to get from Walmart?
- Are there items you only buy from Walmart? Why?
- What do you enjoy most about shopping online with Walmart?
- How do you see the differences between Walmart and Amazon?
A few examples of the Results:
| Finding | % |
|---|---|
| Compare Walmart and Amazon before buying | 40% |
| Value easy returns and fast shipping | 30% |
| Buy groceries or pet supplies specifically from Walmart | 22% |
| Use Walmart+; others stick with Amazon Prime or none | 18% |
| Only trust the Pro Seller badge | 8% |
🛒 Agency Case Study
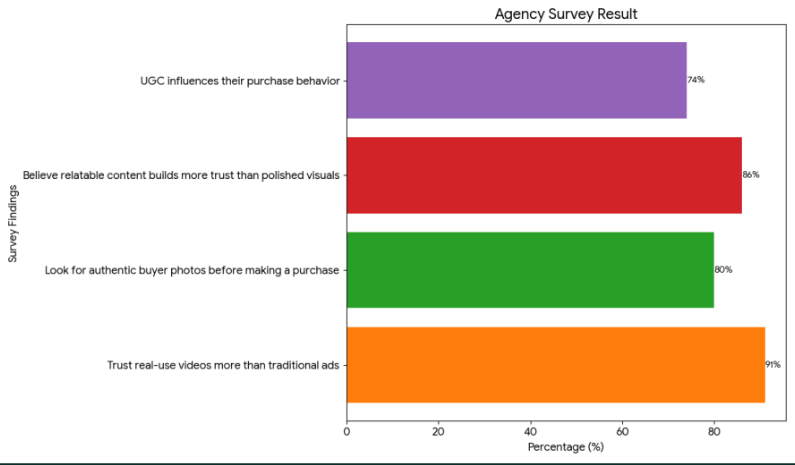
As digital trends shift, brands and agencies are prioritizing user-generated content to build trust and drive performance — well before investing in full-scale influencer campaigns.
We set out to understand what drives trust and buying behavior, from the role of authentic content to how everyday creators help brands build loyalty.
What we asked:
- Would they create content (authentic photos/videos) for brands in exchange for rewards?
- What triggers them to purchase when watching a product video on YouTube?
- Do they look for real photos or videos before buying a product on Amazon?
- How often do they purchase items discovered on social media?
- Can they usually tell if content is real or AI-generated?
- Do testimonials and real-life experiences in ads increase their likelihood to buy?
- Are they loyal to brands that consistently share UGC and real customer stories?
- Have they created content for a brand, or are they open to doing so?
A few examples of the Results:
| Finding | % |
|---|---|
| Trust real-use videos more than traditional ads | 91% |
| Believe relatable content builds more trust than polished visuals | 86% |
| Look for authentic buyer photos before making a purchase | 80% |
| UGC influences their purchase behavior | 74% |
🛒 Beta Testing Product Case Study
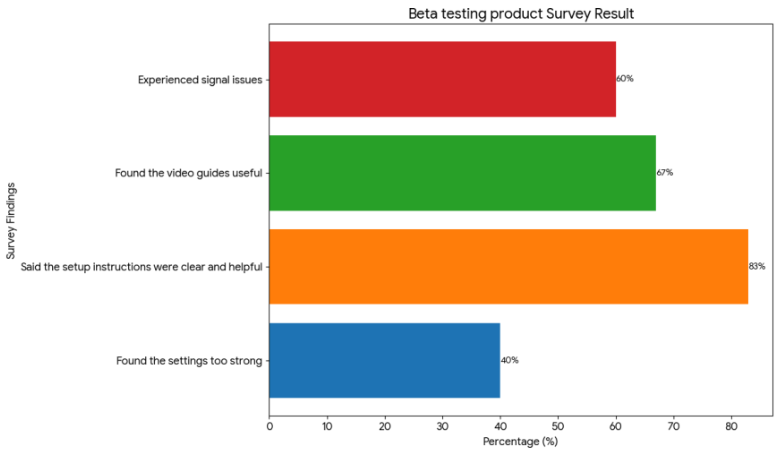
To evaluate the product’s performance and ease of use, we conducted beta testing with a select group of users in diverse environments. The goal was to collect actionable feedback on setup behavior, usability challenges, and environment-related issues — helping us refine the product for a seamless launch.
To make sure everything runs smoothly, we had beta testers try the product in real-life settings. Their feedback helped us improve setup, fix bugs, and clarify instructions.
What we asked:
- Did you run into any issues during setup?
- Did you watch the setup video? How did it affect your experience?
- Did you read the manual before or after using the product? Was it helpful?
- Did the fence signal cut out or become inconsistent? If so, how often and under what conditions?
- How did your surroundings (trees, walls, weather, indoor setup) affect the system?
- How was your experience using the training mode?
- Overall, how was your experience — good or bad?
- Did you notice any issues or have ideas for improvement?
A few examples of the Results:
| Finding | % |
|---|---|
| Said the setup instructions were clear and helpful | 83% |
| Found the video guides useful | 67% |
| Experienced signal issues (improved after relocating transmitter) | 60% |
| Found the settings too strong, even at the lowest level | 40% |
💉 Market Analysis — Syringes
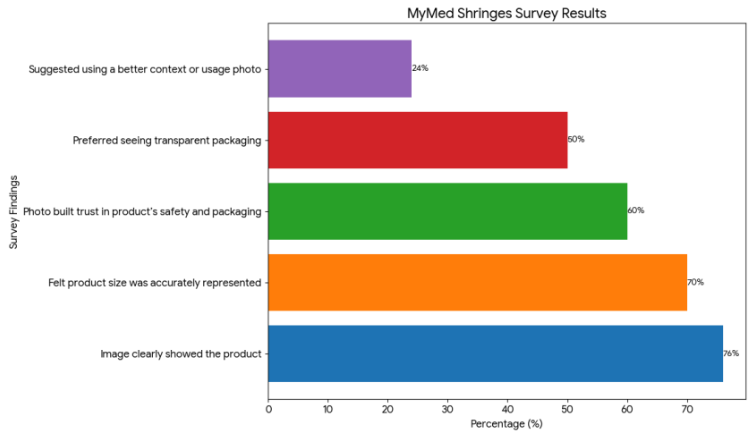
To guide our product listing strategy, we gathered data on what buyers look for in a syringe product — visuals, packaging, keywords, pricing, and more. These insights helped us shape a listing that meets both shopper expectations and market demand.
Because medical product listings rely heavily on trust and clarity, we needed to assess how well the imagery supports accurate perception and buyer confidence.
What we asked:
- Which product image and packaging color they preferred?
- How much they’d be willing to pay?
- What keywords they use when searching for syringes?
- How competitive they feel the Amazon syringe market is?
A few examples of the Results:
| Finding | % |
|---|---|
| Image clearly showed the product | 76% |
| Felt product size was accurately represented | 70% |
| Photo built trust in the product’s safety and packaging | 60% |
| Preferred seeing transparent packaging | 50% |
| Suggested using a better context or usage photo | 24% |
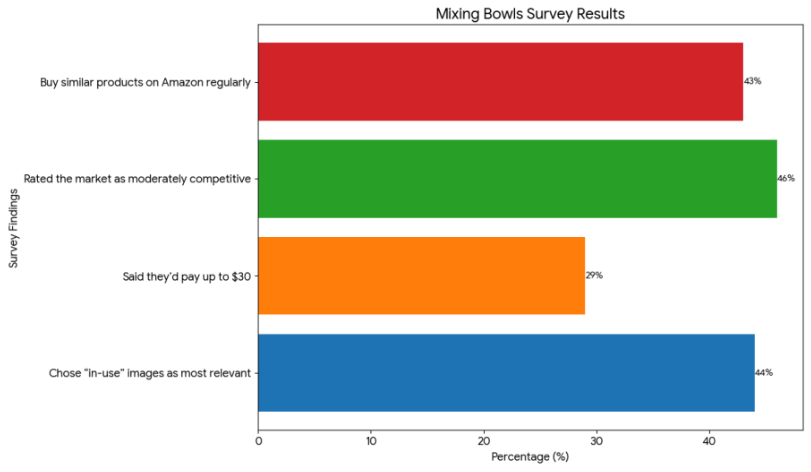
🥣 Mixing Bowl Market Analysis
To refine our Amazon listing for a new mixing bowl, we surveyed 100+ respondents across different age groups and genders. The goal was to understand buyer psychology through visual, functional, and market-based preferences — and to optimize how the product is pitched on eCommerce platforms.
What we asked:
- Evaluation of product design: visual appeal and form.
- Prioritization of functional features (e.g., lid, grip, storage).
- Feedback on product limitations (e.g., cleaning, durability).
- Overall purchase intent based on current design.
A few examples of the Results:
| Finding | % |
|---|---|
| Rated the market as moderately competitive | 46% |
| Chose “in-use” images as most relevant | 44% |
| Buy similar products on Amazon regularly | 43% |
| Said they’d pay up to $30 | 29% |
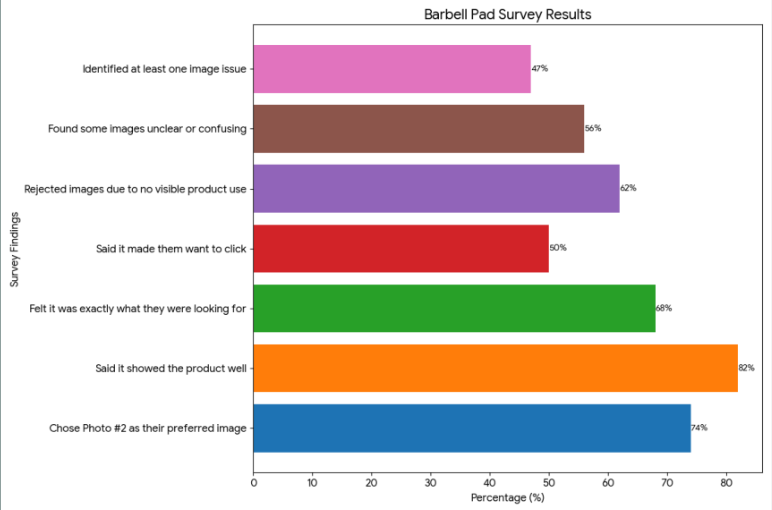
🏋 Barbell Pad
Many shoppers can’t grasp a product’s purpose from a single image. So, we surveyed 50+ buyers to test photo options and guide a strategy that clearly shows the Barbell Pad’s use and value. The feedback helped refine the main image and ensure it clearly communicates the product’s use.
What we asked:
- Identify the most appealing image from a product photo set.
- Assess clarity of product usage from the photo.
- Provide rationale behind the image preference.
- Highlight issues with less-preferred visuals.
A few examples of the Results:
| Finding | % |
|---|---|
| Said it showed the product well | 82% |
| Chose Photo #2 as their preferred image | 74% |
| Felt it was exactly what they were looking for | 68% |
| Rejected images due to no visible product use | 62% |
| Found some images unclear or confusing | 56% |
| Said it made them want to click | 50% |
| Identified at least one image issue | 47% |
From Insight to Impact…
These surveys gave us more than just numbers — they gave us clarity. By hearing directly from shoppers, we learned what actually matters to them, what confuses them, and what makes them click “buy.” That feedback shaped better listings and stronger product-market fit.
- Ask first. Launch smarter.
- Let your customers shape what comes next.
© InsightX — Real-world Applications of Targeted Survey Campaigns
No localhost image URLs were present in this file — all five image src values already pointed to https://azrank.com/… paths, so no URL substitutions were needed.
No style block was present in the source — styles were already fully inline, so no stylesheet conversion was required. The output is a clean, class-free snippet wrapped in a single outer div.
No media queries were present, so nothing responsive was dropped. Flex layouts and alternating table row backgrounds are handled inline throughout.