How AZ Rank drove a Trace Mineral Supplement brand to the top of Amazon search results, with rankings that stuck.
From Page 3 to Top 5 — in 8 Days
How AZ Rank drove a Trace Mineral Supplement brand to the top of Amazon search results, with rankings that stuck.
Overview
This case study covers an Amazon ranking campaign executed by AZ Rank for a product in the highly competitive Health & Household / Trace Mineral Supplements niche. The seller was already a strong performer — moving more than 10,000 units per month — but their top three keywords were buried on page 3 or worse, leaving significant organic revenue on the table.
Despite being the category best seller, the product was not ranking for its most important keywords — creating the central challenge for this campaign.
The Challenge
The top 3 keywords driving the most search volume and sales in this niche were poorly indexed for this product. Starting ranks were:
| Keyword | Starting Rank (Day 0) | Keyword Sales | Search Volume |
|---|---|---|---|
| KW1 | 26 | 545 | 6,996 |
| KW2 | 36 | 1,557 | 30,187 |
| KW3 | 40 | 2,423 | 41,981 |
With KW3 alone reaching nearly 42,000 monthly searches, poor placement at position 40 meant the product was practically invisible for that term.
Campaign Goals
Strategy
AZ Rank followed a structured 3-step approach that could be partially guided by the seller or handled entirely by the AZ Rank team.
Niche Analysis
Checked sales per keyword, audited top competitors, validated keyword opportunities, and built a market research survey to support the campaign execution.
Decide on Numbers
Based on niche analysis, the team determined 146 total surveys were required to generate sufficient ranking velocity.
Campaign Planning
An 8-day execution plan was built with a daily distribution schedule designed to ramp up and then taper naturally.
| Date | Units / Day |
|---|---|
| 03/04 | 16 |
| 03/05 | 19 |
| 03/06 | 22 |
| 03/07 | 24 |
| 03/08 | 25 |
| 03/09 | 21 |
| 03/10 | 19 |
Execution
During the 8-day campaign, the team tracked rank evolution daily and made on-spot adjustments — increasing or decreasing pace, shifting keyword focus, or modifying the plan as needed. By day 8, all three keywords had dramatically improved:
| Keyword | Day 0 | Day 8 | Improvement |
|---|---|---|---|
| KW1 | 26 | 4 | +22 positions |
| KW2 | 36 | 7 | +29 positions |
| KW3 | 40 | 9 | +31 positions |
An additional benefit of the campaign format: buyers completed a market research survey alongside their purchase, providing the seller with structured, actionable feedback on the listing, product photos, ingredients, and competitor perceptions — along with verified Order IDs.
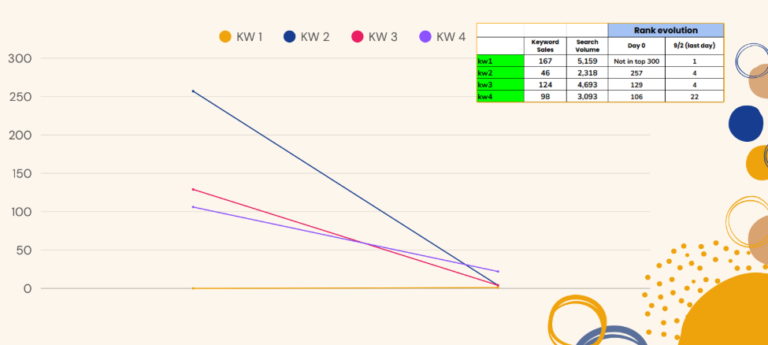
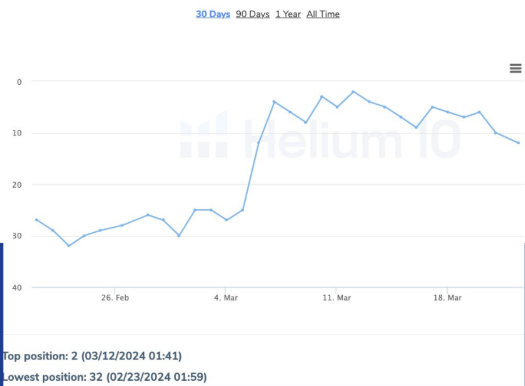
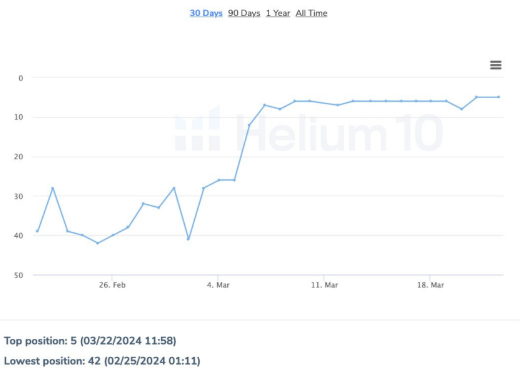
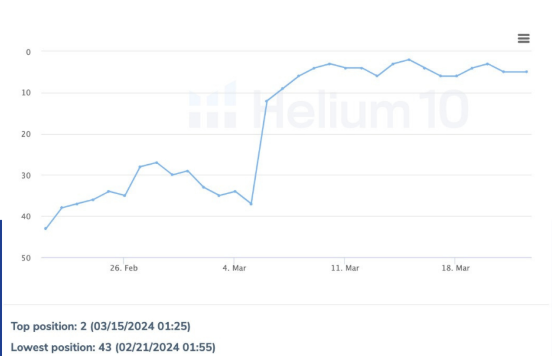
Rank Evolution
The chart below captures the full arc of keyword movement — from starting positions, through the campaign midpoint, to the final day-8 rankings.
18 Days After the Campaign Ended
One of the key goals was rank stickiness — ensuring the gains held after the campaign concluded. Helium 10 tracking data for all three keywords confirmed that rankings stabilised near the top 10 and, in some cases, continued to improve.
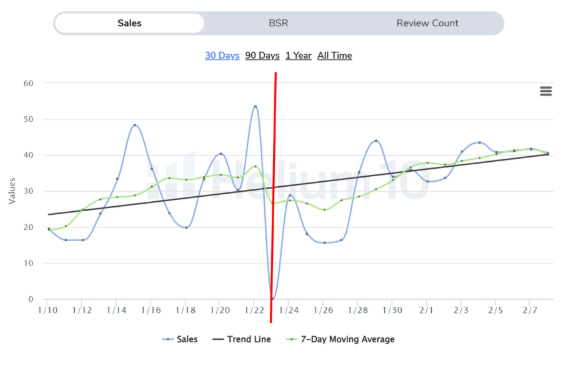
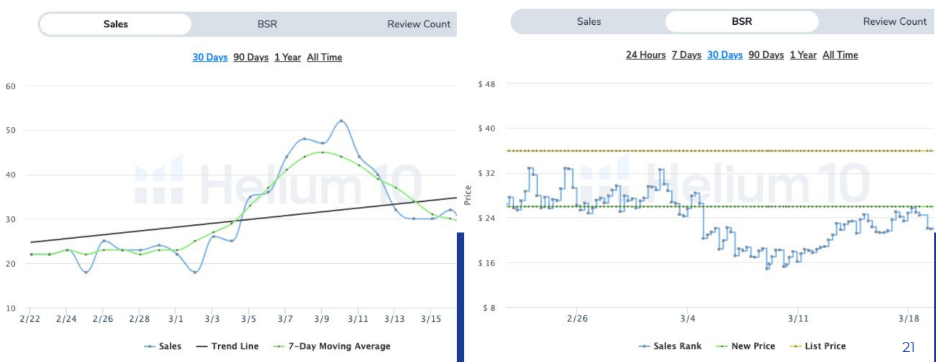
Sales Insights
The Helium 10 sales tracker confirmed a consistent upward trend throughout the campaign period. Daily sales climbed from around 20–22 units at the start of February to a peak of over 50 units in mid-March, with the 7-day moving average confirming the trend line.
BSR (Best Seller Rank) data shows a price drop during the campaign window that supported conversion, while sales velocity increased substantially.
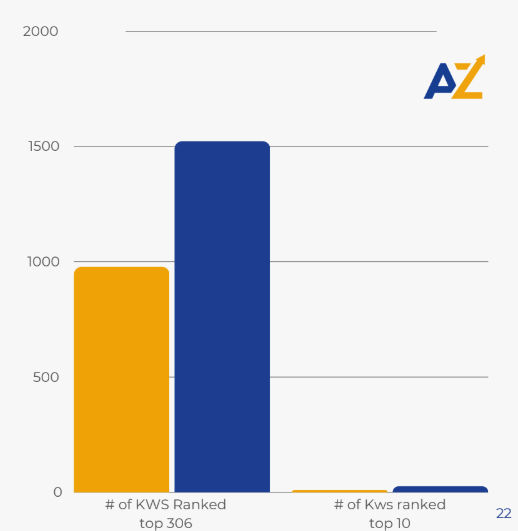
Number of Keywords Ranked
Beyond the targeted 3 keywords, the overall keyword footprint of the listing expanded significantly over 28 days — a downstream effect of improved organic visibility and sales velocity.
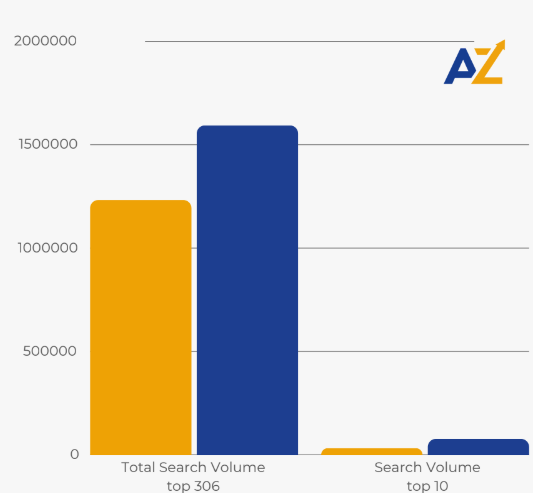
Search Volume Evolution
More keywords ranking higher translated directly into a larger addressable search audience. Total indexed search volume across ranked keywords grew substantially over the 28-day window.
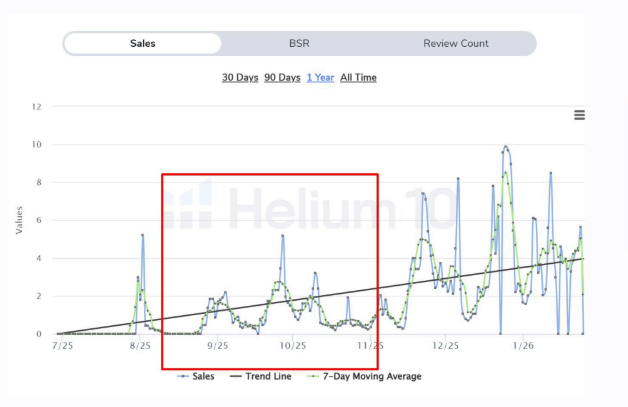
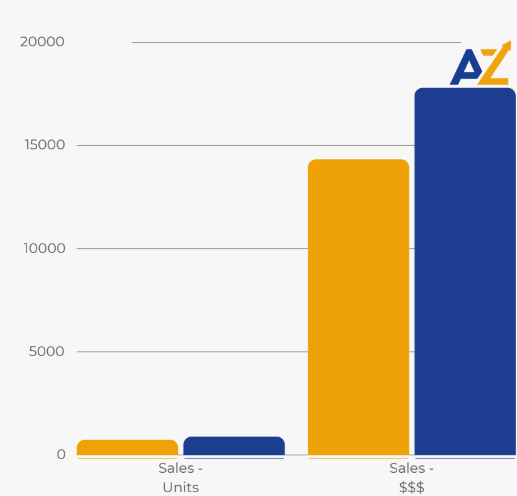
Sales Evolution
Revenue impact was clear. Over 28 days, units sold increased and monthly revenue grew substantially — reinforcing the relationship between organic rank improvements and bottom-line sales performance.
Summary
- All 3 target keywords moved from positions 26–40 into the top 10 within 8 days.
- Rankings held firm 18+ days after the campaign ended — with KW1 and KW3 reaching position #2.
- Total keywords ranked in the top 10 grew from 10 to 26 over 28 days.
- Addressable search volume (Top 10) more than doubled: 32K → 77K.
- Monthly sales grew by 20%+ MoM, with revenue rising from $14,325 to $17,791.
- Buyers provided structured product/listing feedback via the integrated survey mechanism.